To keep the world within the desired 1.5C of warming, the carbon dioxide concentration in the atmosphere has to be kept below 500ppm. To achieve this the ambition agreed at COPxx in Paris in 2015 is to reduce global carbon emissions by 45% by 2030 and to net zero by 2050.
In 2015 global carbon dioxide emissions were just over 35 billion tonnes, in 2019 emissions reached 37 billion tonnes, and having dropped back to 35 billion tonnes in 2020 during covid, emissions are again back up at 37 billion tonnes (2022).
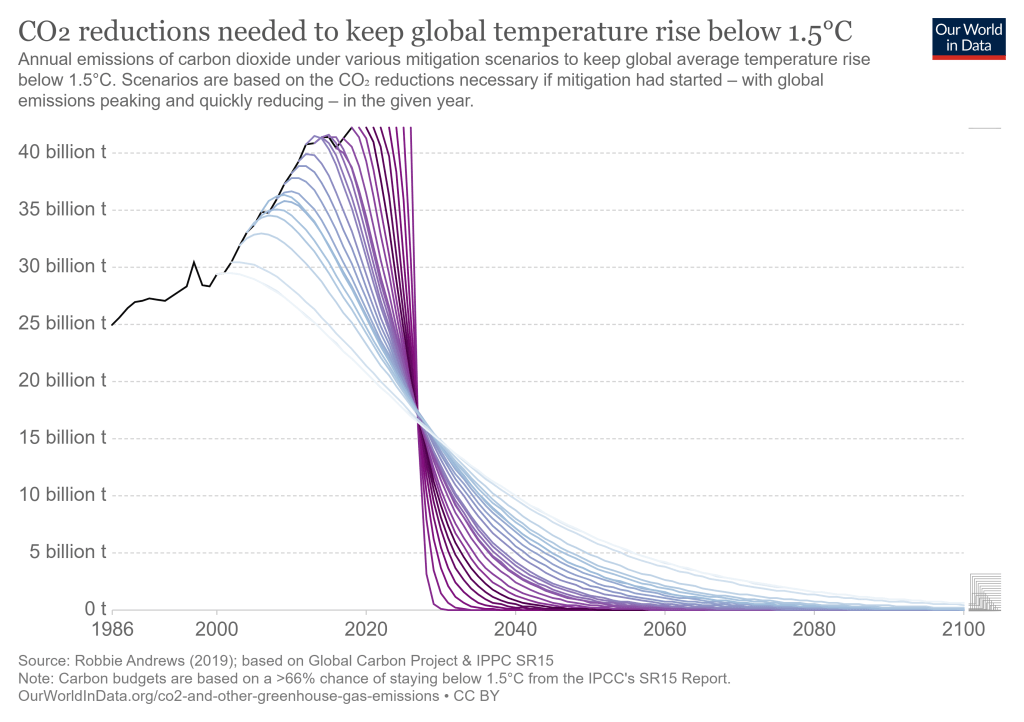
Each year that passes without meeting these targets means that to achieve the 2030 and 2050 targets becomes even more difficult as we have to cut back emissions even more steeply. This is vividly shown in the graph below.
Keeping the temperature rise – global warming – within 1.5C necessitates constraining the carbon dioxide (and other greenhouse gas) emissions we release into the atmosphere. The diagram below shows the correlation between global temperatures and carbon dioxide concentrations in the atmosphere.
Keeping global warming within this window involves both reducing the amount of greenhouse gases we emit and enhancing processes that absorb such gas emissions. An example of the first would be reducing – or even cutting out entirely – the burning of fossil fuels; an example of the second would be reinstating woodlands and wetlands.
Likely tipping points if we reach 1.5c of warming include the loss of boreal permafrost in the artic regions. This would result in the release of large amounts of methane rapidly increasing the rate of global warming. Another potential tipping point would be the die-out of mangroves and seagrass meadows in the tropics, reducing how much carbon dioxide is absorbed by the oceans and so fuelling further global warming.
1.5C is the level of warming within which we should be trying to stay if we are to avoid an unbearably worse deterioration of the global climate. This figure is the product of over 6,000 scientific references, and was prepared by 91 authors from 40 countries. https://en.wikipedia.org/wiki/Special_Report_on_Global_Warming_of_1.5_°C
This is not to say that even with global warming at 1.5C there won’t be adverse effects. The extreme hot summer temperatures, floods, wild fires, droughts, and storms that we have experienced over the last few years will now be the norm. Glaciers, sea ice and ice caps will continue to melt and disappear, causing rivers to dry up in the summer, and elsewhere raising sea levels. The change in climate is already altering natural habitats reducing numbers of plants, birds, animals, insects etc, and having similar adverse effects on agriculture. Food and water security are already being threatened. Warming oceans is reducing marine life. All this will increase as temperatures rise.
Each fraction of a degree of further global warming will accentuate these problems for all life forms. The charts show how much greater would be the effects of 2C warming over 1.5C.
Global warming is defined by the IPCC as “an increase in combined surface air and sea surface temperatures averaged over the globe and over a 30-year period. Unless otherwise specified, warming is expressed relative to the period 1850–1900, used as an approximation of pre-industrial temperatures… For periods shorter than 30 years, warming refers to the estimated average temperature over the 30 years centred on that shorter period…” (1) https://www.ipcc.ch/sr15/ An IPCC Special Report on the impacts of global warming of 1.5°C 2018
The chart below shows a baseline which is the average (mean) of the combined surface air and sea surface temperatures for the period 1850-1900. The bred and blue columns shows the annual deviation around that base line. Between 1850 and 1900 the blue and red columns cancel each other out. The increasing number and height of the red lines thereafter show the extent of global warming.
The concentration of carbon dioxide is measured as so many ‘parts per million’. Measurements of carbon dioxide are made at the Mauna Loa Observatory, Hawaii (NOAA). Recordings there first began in 1958.
Pre industrial levels of CO2 were fairly constant (for at least 6000 years) at around 240ppm. However since the Industrial Revolution this has been rising. Between 1750 and 1800 the average CO2 levels was 278ppm and it is from this baseline that the IPCC has been measuring increases. It has been suggested that between 280 and 350ppm represents a safe level. However we have past 350ppm in 1987. In 2018 scientific models suggested carbon dioxide levels of 425-785 ppm would lead to 1.5 °C temperature rise, and and 489-1106 ppm for 2 °C.
As of January 2024 the level of carbon dioxide had risen to 423ppm. In 2023 global temperatures were 1.5 °C higher than the pre-industrial average – but this in part was due to the El Niño effect, so in terms of human-made heating, the rise for 2023 is calculated at 1.3°C of warming.
The red lines and symbols represent the monthly mean values, centered on the middle of each month. The black lines and symbols represent the same, after correction for the average seasonal cycle. The latter is determined as a moving average of SEVEN adjacent seasonal cycles centered on the month to be corrected, except for the first and last THREE and one-half years of the record, where the seasonal cycle has been averaged over the first and last SEVEN years, respectively.
Greenhouse gases is a collective name for all the gases that cause the greenhouse effect – including water vapour, carbon dioxide, methane, nitrous oxide, ozone, and others. The greenhouse gas effects describes how these gases create an insulating layer in the atmosphere that keeps heat in. Without some degree of insulation like this, the world would be a very cold environment and would not support the life forms we currently have. Gases like water vapour and carbon dioxide, for example, occur naturally as plants and creatures breathe. Greenhouse gases become a problem for use when they become excessive, trapping in more heat that destabilises the earth’s systems.
Too much carbon dioxide is a particular problem because once in the atmosphere it stays there for thousands of years. Whilst on the hand methane has a life of only 12 years but in that short time the warming effect it causes is far greater than that of carbon dioxide.
Over the next few weeks I plan to look at some of the words and phrases we use in connection with the climate crisis.
Climate change is any sustained change in the global climate that occurs over the long term – at least a decade. Climate change is not new. Over the last thousand years there have been changes in climate such as the ‘mini ice age’ which refers to a period between 1300 and 1850 when temperatures fell by about 0.5C producing colder winters when in England the Thames froze and cooler summers when people noted the lack of sunny days. This period coincided with a larger than usual number of volcanic eruptions around the world. Volcanic ash in the atmosphere can produce more cloud and reduce temperatures.
Over the longer time scale there have been real ice ages when temperatures have really plummeted.
The last glacial period ended 11,000 years ago having lasted for about 100,000 plus years. During that time temperatures fell by about 6C below our current 20th century average.
Climate change is now frequently used to mean anthropogenic climate change – climate change that has been caused by human activities.
Talk about what you see in the world around you – the things of beauty, the things that make you love – but also the things that upset you, the things that seem to be going awry. Both are important as it can be easy to get into a blinkered viewpoint of the world. And talking with others helps us to keep a balance view and to stay informed.
Go outside and find a plant or a tree that captures your attention. Take some time to really look at it, to experience what it looks like, how it has been growing, how it fits into its environment – even how does it respond to rain. Be grateful for its presence.