
17th February
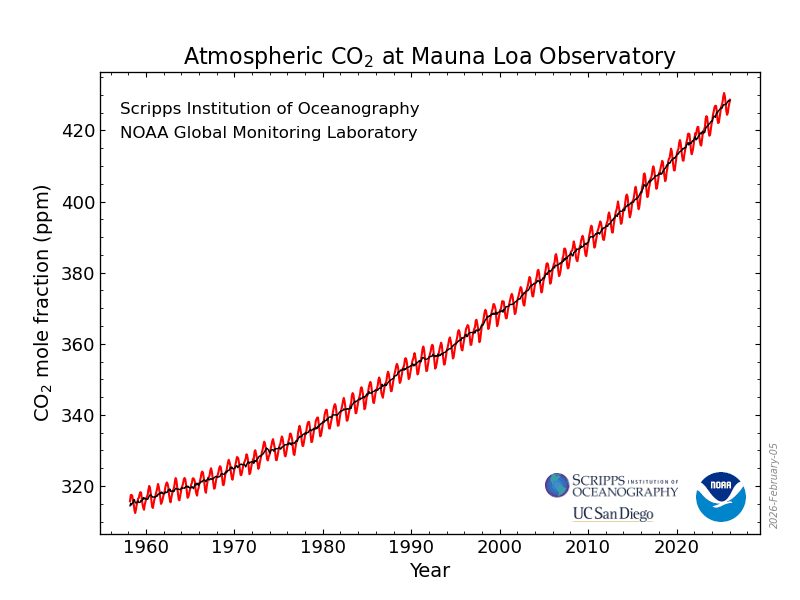
The main cause of climate change is the increase in carbon dioxide emissions – and it is an increase caused by human activities. The following chart shows the annual levels of CO2 emissions measured in parts per million. 350 ppm is the safe planetary boundary. (1)
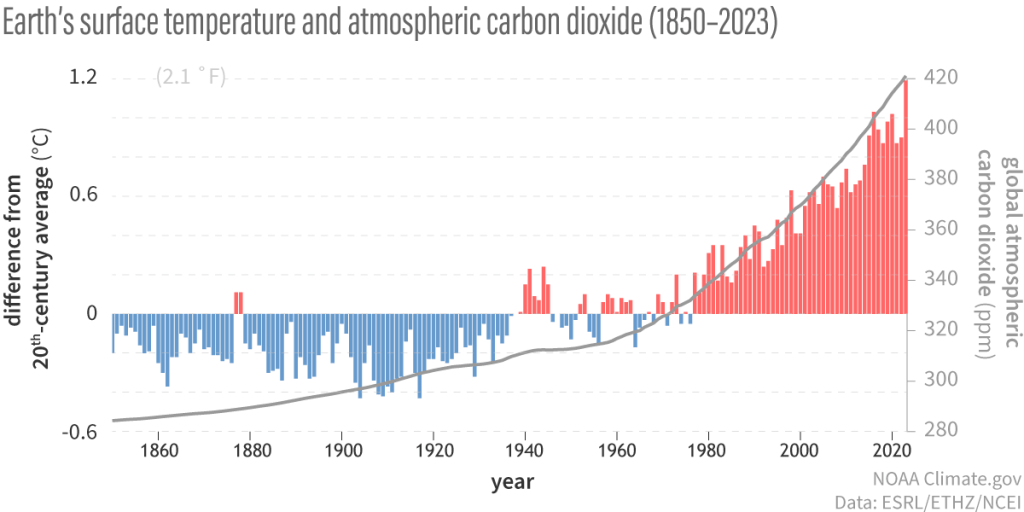
The second chart shows the correlation between rising levels of CO2 emissions and global temperatures. (2)
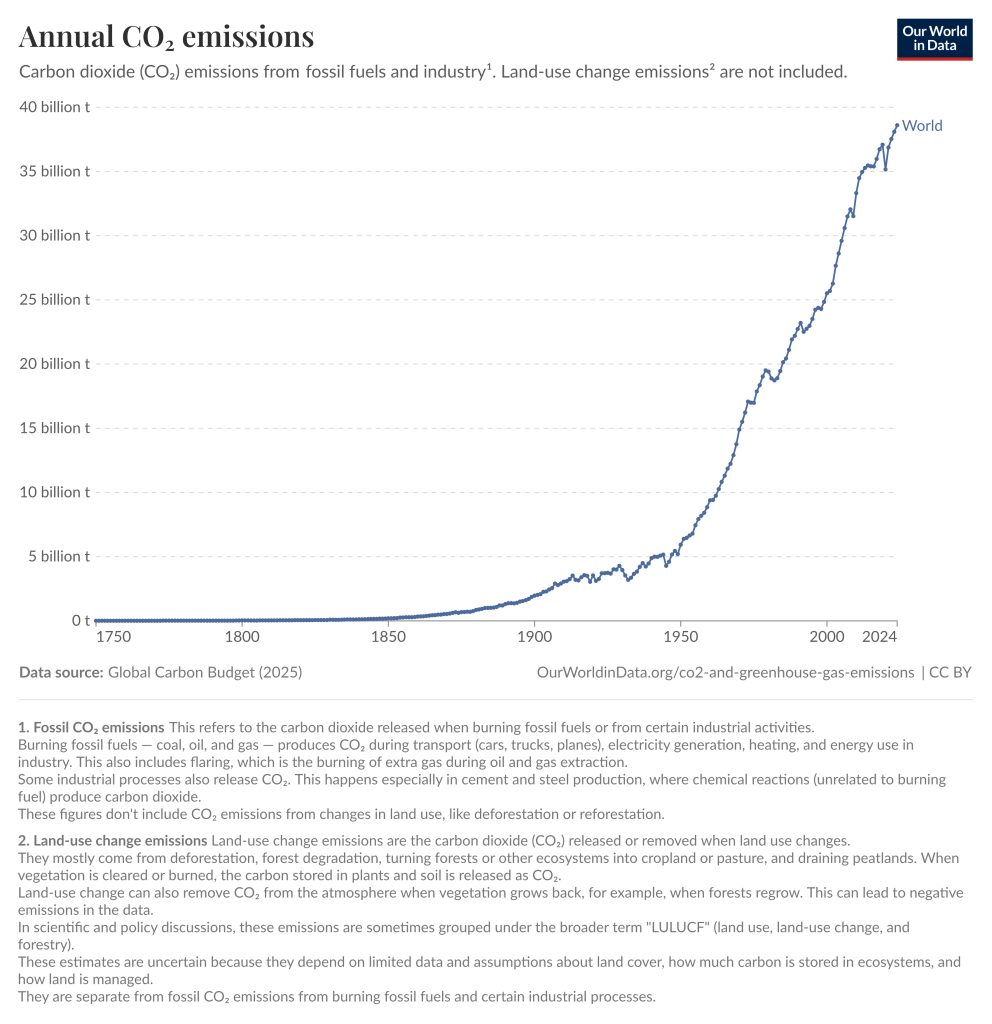
Once released into the atmosphere, carbon dioxide remains there for centuries. So it is important to understand not just how much we emit each year, but also how much has already accumulated in the atmosphere and to which we are now adding. The chart below comes from an article produced by Our
World in Data. (3)
Whilst climate deniers may point to periods on the past when temperatures in the UK during the past two thousand years have been higher than average, there has been no period during human history when global temperatures have risen to the levels now seen and nor when carbon emissions HVO been at current levels. We have very clearly passed the safe planetary boundary vis a vis carbon dioxide emissions.


