
11th April 2024
Fossil Fuel Subsidies -1
This overview of fossil fuel subsidies comes from the IMF: “Subsidies are intended to protect consumers by keeping prices low, but they come at a substantial cost. Subsidies have sizeable fiscal consequences (leading to higher taxes/borrowing or lower spending), promote inefficient allocation of an economy’s resources (hindering growth), encourage pollution (contributing to climate change and premature deaths from local air pollution), and are not well targeted at the poor (mostly benefiting higher income households). Removing subsidies and using the revenue gain for better targeted social spending, reductions in inefficient taxes, and productive investments can promote sustainable and equitable outcomes.” (1)
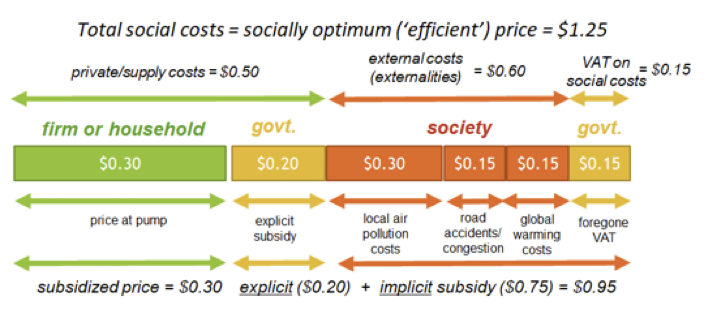
The article goes on to explain the difference between explicit and implicit subsidies, the former being the obvious direct payments to fossil fuel producers to bring down the unit cost of the fuel. The latter is a subsidy that is likely always present, vis in the practice of not charging the fossil fuel producers for the costs of pollution, climate change etc that are a consequence of their business.
“Implicit subsidies occur when the retail price fails to include external costs, inclusive of the standard consumption tax. External costs include contributions to climate change through greenhouse gas emissions, local health damages (primarily pre-mature deaths) through the release of harmful local pollutants like fine particulates, and traffic congestion and accident externalities associated with the use of road fuels”(1)
By way of example they provide the following bar chart:
(1) https://www.imf.org/en/Topics/climate-change/energy-subsidies

